





Sri Lanka vs West Indies Player Ratings · T20 World Cup 2016
 West Indies
122/9
20 ov
West Indies
122/9
20 ov
Statz Rating
A contextual performance score measuring each player's overall impact in the match. Scaled against the season so ratings are directly comparable across fixtures.
| Rank | Player | Rating |
|---|---|---|
| 1 |

Samuel Badree
WI
|
142.9 |
| 2 |

Andre Fletcher
WI
|
92.7 |
| 3 |

Jeffrey Vandersay
SL
|
85.0 |
| 4 |

Andre Russell
WI
|
73.8 |
| 5 |

Thisara Perera
SL
|
67.8 |
| 6 |

Dwayne Bravo
WI
|
57.2 |
| 7 |
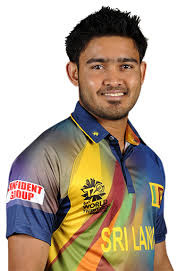
Milinda Siriwardana
SL
|
48.8 |
| 8 |

Tillakaratne Dilshan
SL
|
29.2 |
| 9 |
Dinesh Chandimal
SL
|
24.0 |
| 10 |

Carlos Brathwaite
WI
|
22.7 |
| 11 |
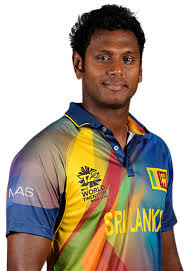
Angelo Mathews
SL
|
20.0 |
| 12 |

Sulieman Benn
WI
|
18.9 |
| 13 |

Nuwan Kulasekara
SL
|
17.8 |
| 14 |

Rangana Herath
SL
|
14.4 |
| 15 |

Dushmantha Chameera
SL
|
13.1 |
| 16 |
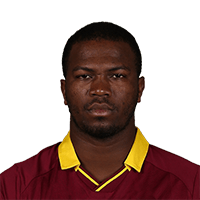
Johnson Charles
WI
|
12.6 |
| 17 |
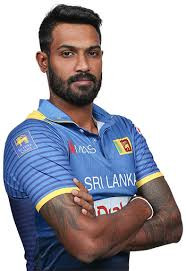
Chamara Kapugedera
SL
|
8.4 |
| 18 |
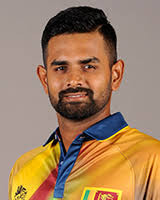
Lahiru Thirimanne
SL
|
6.4 |
| 19 |

Denesh Ramdin
WI
|
6.0 |
| 20 |

Marlon Samuels
WI
|
3.6 |
How Statz Rating works:
- Each player receives a contextual match impact score based on their all-round contribution — batting, bowling, and situational factors.
- Ratings are scaled against the season benchmark so they are directly comparable across fixtures and to the season leaderboard.
- A typical top performer scores around 100. Exceptional performances can exceed 100.

Sri Lanka vs West Indies: result and key facts
West Indies won by 7 wickets (with 10 balls remaining) in T20 World Cup 2016 at M.Chinnaswamy Stadium on 20 March 2016. Andre Fletcher top-scored with 84 off 64 balls and Samuel Badree took 3/12.
Frequently asked questions
Who won Sri Lanka vs West Indies?
West Indies won by 7 wickets (with 10 balls remaining).
When and where was Sri Lanka vs West Indies played?
Sri Lanka vs West Indies was played at M.Chinnaswamy Stadium, Bengaluru on Sunday 20 March 2016, in T20 World Cup 2016.
What were the final scores in Sri Lanka vs West Indies?
Sri Lanka scored 127/3 in 18.2 overs. West Indies scored 122/9 in 20 overs.
Who was the Statz MVP in Sri Lanka vs West Indies?
Samuel Badree was named Statz MVP, earning a Statz Rating of 143/100. The Statz Rating combines batting impact, bowling impact and match context.
Who was the top run-scorer in Sri Lanka vs West Indies?
Andre Fletcher top-scored with 84 off 64 balls.
Who took the most wickets in Sri Lanka vs West Indies?
Samuel Badree took 3/12 in 4 overs.
Who played in Sri Lanka vs West Indies?
Sri Lanka XI: Dinesh Chandimal (wk), Tillakaratne Dilshan, Lahiru Thirimanne, Chamara Kapugedera, Angelo Mathews (c), Milinda Siriwardana, Thisara Perera, Nuwan Kulasekara, Rangana Herath, Jeffrey Vandersay, Dushmantha Chameera. West Indies XI: Andre Fletcher, Johnson Charles, Marlon Samuels, Denesh Ramdin (wk), Andre Russell, Chris Gayle, Darren Sammy (c), Sulieman Benn, Samuel Badree, Carlos Brathwaite, Dwayne Bravo.