






T20 Cricket World Cup 2026
InternationalT20 Cricket World Cup Player Economy Rate 2026
Every player ranked on economy rates. Sorted on at least 10 overs.
Updated 8 March 2026, after New Zealand vs India
| #Player | M | Overs | Wkts | Econ | Avg | SR | Dots | Dot % | Mdns | Best |
|---|---|---|---|---|---|---|---|---|---|---|
1
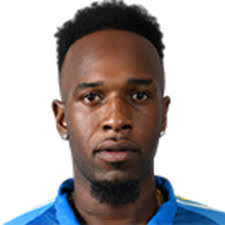  Matthew Forde All-rounder |
5 | 18 | 1.2 | 5.17 | 15.50 | 18.0 | 11.6 | 53.7% | 0.20 | 3 |
2
  Mohammad Mohsin All-rounder |
4 | 12 | 1.0 | 6.00 | 18.00 | 18.0 | 7.8 | 43.1% | 0.0 | 2 |
3
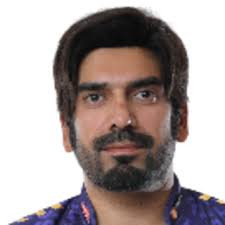  Usman Tariq Bowler |
3 | 11.4 | 2.3 | 6.09 | 10.14 | 10.0 | 9.0 | 38.6% | 0.33 | 4 |
4
  Mitchell Santner All-rounder |
3 | 12.3 | 0.0 | 6.16 | - | - | 8.7 | 34.7% | 0.0 | 0 |
5
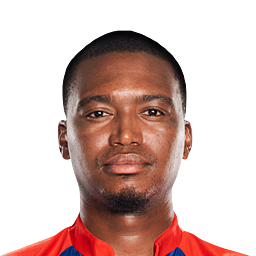  Lungi Ngidi Bowler |
6 | 25.4 | 2.0 | 6.43 | 13.75 | 12.8 | 11.7 | 45.5% | 0.0 | 4 |
6
 Shadley van Schalkwyk All-rounder |
4 | 15.1 | 3.3 | 6.66 | 7.77 | 7.0 | 9.5 | 41.8% | 0.0 | 4 |
7
 Matt Henry Bowler |
4 | 15.3 | 1.3 | 6.97 | 21.60 | 18.6 | 10.5 | 45.2% | 0.0 | 2 |
8
  Blessing Muzarabani Bowler |
4 | 16.1 | 2.5 | 7.05 | 11.40 | 9.7 | 10.5 | 43.3% | 0.25 | 4 |
9
M  Muhammad Jawad Ullah Bowler |
3 | 10.2 | 1.0 | 7.26 | 25.00 | 20.7 | 7.7 | 37.1% | 0.0 | 1 |
10
 Gudakesh Motie Bowler |
6 | 20.2 | 1.7 | 7.33 | 14.90 | 12.2 | 6.8 | 33.6% | 0.17 | 4 |
11
 Corbin Bosch All-rounder |
5 | 19.3 | 1.6 | 7.38 | 18.00 | 14.6 | 8.6 | 36.8% | 0.0 | 2 |
12
 Mohammad Nawaz All-rounder |
4 | 15.2 | 1.3 | 7.43 | 22.80 | 18.4 | 8.3 | 35.9% | 0.0 | 2 |
13
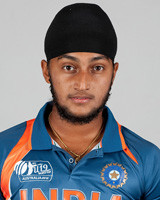 Harmeet Singh All-rounder |
4 | 15.1 | 1.8 | 7.45 | 16.14 | 13.0 | 6.8 | 29.7% | 0.0 | 4 |
14
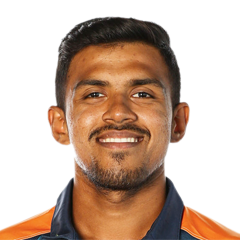  Maheesh Theekshana Bowler |
4 | 16.3 | 1.5 | 7.45 | 20.50 | 16.5 | 10.0 | 40.4% | 0.0 | 3 |
15
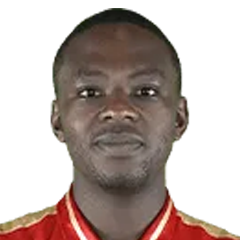 Kagiso Rabada Bowler |
5 | 21.1 | 0.80 | 7.51 | 39.75 | 31.8 | 10.2 | 40.2% | 0.0 | 2 |
16
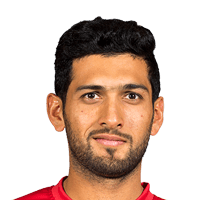 Sikandar Raza All-rounder |
4 | 13.1 | 0.50 | 7.52 | 49.50 | 39.5 | 4.5 | 22.8% | 0.0 | 1 |
17
 Keshav Maharaj Bowler |
5 | 18.5 | 1.0 | 7.75 | 29.20 | 22.6 | 6.2 | 27.4% | 0.0 | 3 |
18
 Dunith Wellalage Bowler |
4 | 15.4 | 1.3 | 7.85 | 24.60 | 18.8 | 7.3 | 30.9% | 0.0 | 3 |
19
 Lockie Ferguson Bowler |
3 | 10.3 | 1.3 | 7.90 | 20.75 | 15.8 | 8.0 | 38.1% | 0.0 | 2 |
20
 Haider Ali Bowler |
4 | 15.2 | 0.25 | 7.96 | 122.00 | 92.0 | 7.3 | 31.5% | 0.0 | 1 |
21
 Dilshan Madushanka Bowler |
3 | 11.3 | 1.7 | 8.00 | 18.40 | 13.8 | 9.3 | 40.6% | 0.0 | 3 |
22
 Jason Holder All-rounder |
6 | 21.1 | 1.7 | 8.17 | 17.30 | 12.7 | 8.3 | 39.4% | 0.0 | 4 |
23
 Muhammad Arfan Bowler |
4 | 13.5 | 0.75 | 8.31 | 38.33 | 27.7 | 4.5 | 21.7% | 0.0 | 2 |
24
 Shamar Joseph Bowler |
6 | 24 | 1.5 | 8.38 | 22.33 | 16.0 | 9.0 | 37.5% | 0.0 | 4 |
25
  Sandeep Lamichhane Bowler |
3 | 10 | 0.33 | 8.50 | 85.00 | 60.0 | 8.3 | 41.7% | 0.0 | 1 |
26
 Junaid Siddique Bowler |
4 | 15 | 1.8 | 8.53 | 18.29 | 12.9 | 8.3 | 36.7% | 0.0 | 5 |
27
 Akeal Hosein Bowler |
6 | 19 | 1.2 | 8.58 | 23.29 | 16.3 | 8.0 | 42.1% | 0.17 | 3 |
28
 Brad Evans All-rounder |
4 | 14.5 | 2.0 | 8.63 | 16.00 | 11.1 | 8.8 | 39.3% | 0.0 | 3 |
29
 Marco Jansen All-rounder |
5 | 20.4 | 2.2 | 8.90 | 16.73 | 11.3 | 10.4 | 41.9% | 0.0 | 4 |
30
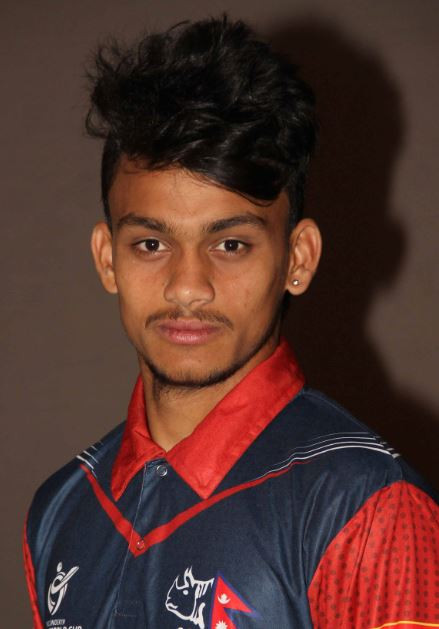 Kushal Bhurtel Batter |
3 | 10.1 | 0.33 | 9.05 | 92.00 | 61.0 | 5.3 | 26.2% | 0.0 | 1 |
31
 Dushmantha Chameera Bowler |
4 | 16.3 | 1.8 | 9.45 | 22.29 | 14.1 | 8.3 | 33.3% | 0.0 | 3 |
|
32
D
Dushan Hemantha All-rounder
|
3 | 10 | 1.0 | 9.70 | 32.33 | 20.0 | 5.3 | 26.7% | 0.0 | 3 |
33
 Saurabh Netravalkar Bowler |
3 | 12.1 | 0.67 | 10.85 | 66.00 | 36.5 | 7.7 | 31.5% | 0.0 | 1 |
34
 James Neesham All-rounder |
3 | 10.2 | 0.67 | 10.94 | 56.50 | 31.0 | 5.3 | 25.8% | 0.0 | 1 |
T20 Cricket World Cup Stats Questions
T20 Cricket World Cup 2026 player and team stats: runs, averages and strike rates, wickets and economy, fielding and Dream11 points, and every side's batting, bowling and fielding. Statz tracks T20 Cricket World Cup 2026 across the points table, season leaderboards and venue scoring trends, updated after every completed match.
T20 Cricket World Cup on Statz
Frequently asked questions
Who scored the most runs in the T20 Cricket World Cup 2026?
Sahibzada Farhan (Pakistan) with 383 runs in 6 matches, at a strike rate of 160.3.
Who took the most wickets in the T20 Cricket World Cup 2026?
Jasprit Bumrah (India) with 14 wickets at 6.00 an over.
Who hit the most sixes in the T20 Cricket World Cup 2026?
Sanju Samson with 24 sixes.