





Sri Lanka vs West Indies Player Ratings · One Day Internationals 2024
 West Indies
196/2
22 ov
West Indies
196/2
22 ov
Statz Rating
A contextual performance score measuring each player's overall impact in the match. Scaled against the season so ratings are directly comparable across fixtures.
| Rank | Player | Rating |
|---|---|---|
| 1 |

Evin Lewis
WI
|
81.7 |
| 2 |

Kusal Mendis
SL
|
77.9 |
| 3 |
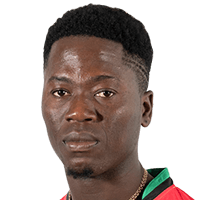
Sherfane Rutherford
WI
|
70.7 |
| 4 |

Asitha Fernando
SL
|
33.2 |
| 5 |

Pathum Nissanka
SL
|
32.1 |
| 6 |
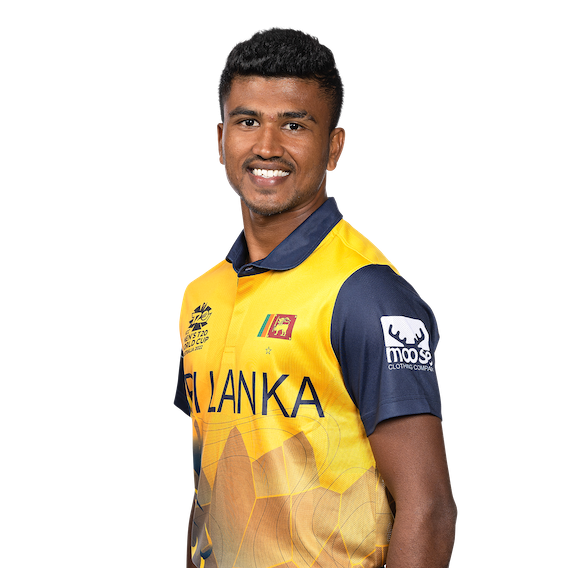
Dilshan Madushanka
SL
|
25.9 |
| 7 |
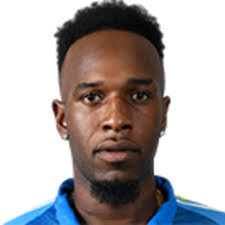
Matthew Forde
WI
|
20.4 |
| 8 |
Avishka Fernando
SL
|
17.6 |
| 9 |

Shai Hope
WI
|
14.3 |
| 10 |
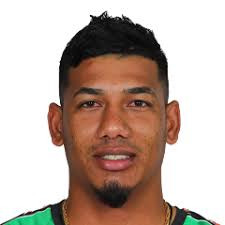
Gudakesh Motie
WI
|
14.3 |
| 11 |

Roston Chase
WI
|
12.6 |
| 12 |
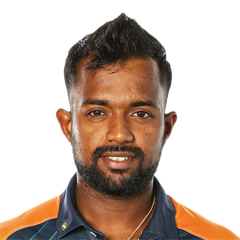
Charith Asalanka
SL
|
12.2 |
| 13 |

Brandon King
WI
|
12.0 |
| 14 |

Maheesh Theekshana
SL
|
10.0 |
| 15 |

Alzarri Joseph
WI
|
7.3 |
| 16 |
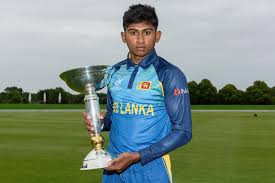
Kamindu Mendis
SL
|
7.0 |
| 17 |
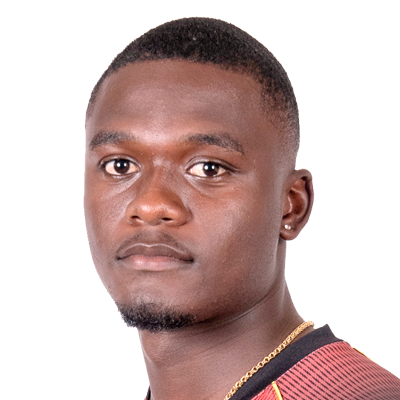
Jayden Seales
WI
|
6.7 |
| 18 |

Wanindu Hasaranga
SL
|
4.1 |
| 19 |
Janith Liyanage
SL
|
2.7 |
How Statz Rating works:
- Each player receives a contextual match impact score based on their all-round contribution — batting, bowling, and situational factors.
- Ratings are scaled against the season benchmark so they are directly comparable across fixtures and to the season leaderboard.
- A typical top performer scores around 100. Exceptional performances can exceed 100.

Sri Lanka vs West Indies: result and key facts
West Indies won by 8 wickets (with 6 balls remaining) (D/L method) in One Day Internationals 2024 at Pallekele International Cricket Stadium on 26 October 2024. Evin Lewis top-scored with 102 off 61 balls and Roston Chase took 1/20.
Frequently asked questions
Who won Sri Lanka vs West Indies?
West Indies won by 8 wickets (with 6 balls remaining) (D/L method).
When and where was Sri Lanka vs West Indies played?
Sri Lanka vs West Indies was played at Pallekele International Cricket Stadium, Pallekele, Kandy on Saturday 26 October 2024, in One Day Internationals 2024.
What were the final scores in Sri Lanka vs West Indies?
Sri Lanka scored 156/3 in 23 overs. West Indies scored 196/2 in 22 overs.
Who was the Statz MVP in Sri Lanka vs West Indies?
Evin Lewis was named Statz MVP, earning a Statz Rating of 82/100. The Statz Rating combines batting impact, bowling impact and match context.
Who was the top run-scorer in Sri Lanka vs West Indies?
Evin Lewis top-scored with 102 off 61 balls.
Who took the most wickets in Sri Lanka vs West Indies?
Roston Chase took 1/20 in 2 overs.
Who played in Sri Lanka vs West Indies?
Sri Lanka XI: Pathum Nissanka, Avishka Fernando, Kusal Mendis (wk), Charith Asalanka (c), Kamindu Mendis, Sadeera Samarawickrama, Janith Liyanage, Wanindu Hasaranga, Maheesh Theekshana, Asitha Fernando, Dilshan Madushanka. West Indies XI: Brandon King, Evin Lewis, Shai Hope (c) (wk), Sherfane Rutherford, Keacy Carty, Jewel Andrew, Roston Chase, Gudakesh Motie, Matthew Forde, Alzarri Joseph, Jayden Seales.