







Australia vs South Africa Scorecard · One Day Internationals 2018





















Statz Rating
A contextual performance score measuring each player's overall impact in the match. Scaled against the season so ratings are directly comparable across fixtures.
| Rank | Player | Rating |
|---|---|---|
| 1 |
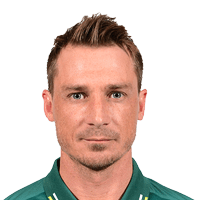
Dale Steyn
SA
|
108.8 |
| 2 |

Kagiso Rabada
SA
|
98.0 |
| 3 |
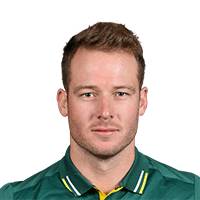
David Miller
SA
|
93.0 |
| 4 |

Mitchell Starc
AUS
|
83.9 |
| 5 |

Marcus Stoinis
AUS
|
72.9 |
| 6 |

Faf du Plessis
SA
|
70.1 |
| 7 |

Shaun Marsh
AUS
|
66.9 |
| 8 |

Dwaine Pretorius
SA
|
64.6 |
| 9 |

Glenn Maxwell
AUS
|
53.0 |
| 10 |

Josh Hazlewood
AUS
|
47.8 |
| 11 |
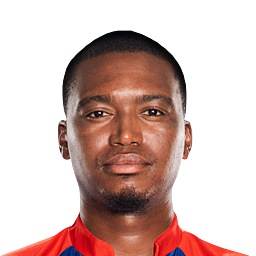
Lungi Ngidi
SA
|
43.7 |
| 12 |
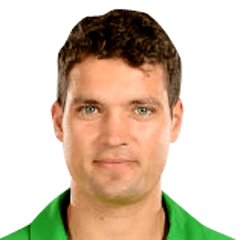
Alex Carey
AUS
|
35.8 |
| 13 |

Aiden Markram
SA
|
24.9 |
| 14 |

Pat Cummins
AUS
|
19.1 |
| 15 |

Adam Zampa
AUS
|
12.3 |
| 16 |

Aaron Finch
AUS
|
10.5 |
| 17 |
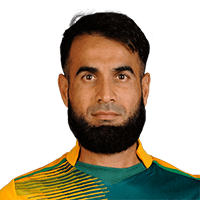
Imran Tahir
SA
|
7.4 |
| 18 |

Reeza Hendricks
SA
|
5.0 |
| 19 |

Travis Head
AUS
|
4.2 |
| 20 |
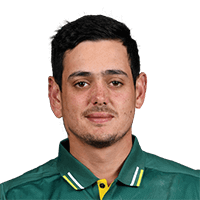
Quinton de Kock
SA
|
3.3 |
| 21 |
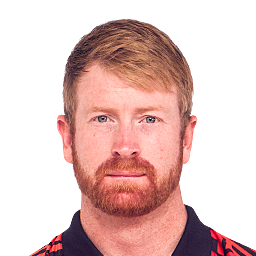
Heinrich Klaasen
SA
|
0.4 |
| 22 |
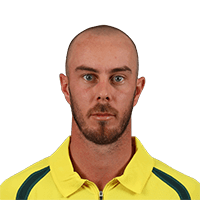
Chris Lynn
AUS
|
0.0 |
How Statz Rating works:
- Each player receives a contextual match impact score based on their all-round contribution — batting, bowling, and situational factors.
- Ratings are scaled against the season benchmark so they are directly comparable across fixtures and to the season leaderboard.
- A typical top performer scores around 100. Exceptional performances can exceed 100.
Australia vs South Africa: result and key facts
South Africa won by 40 runs in One Day Internationals 2018 at Bellerive Oval on 11 November 2018. David Miller top-scored with 139 off 108 balls and Kagiso Rabada took 3/40.
Frequently asked questions
Who won Australia vs South Africa?
South Africa won by 40 runs.
When and where was Australia vs South Africa played?
Australia vs South Africa was played at Bellerive Oval, Bellerive, Hobart, Tasmania on Sunday 11 November 2018, in One Day Internationals 2018.
What were the final scores in Australia vs South Africa?
Australia scored 280/9 in 50 overs. South Africa scored 320/5 in 50 overs.
Who was the Statz MVP in Australia vs South Africa?
Dale Steyn was named Statz MVP, earning a Statz Rating of 109/100. The Statz Rating combines batting impact, bowling impact and match context.
Who was the top run-scorer in Australia vs South Africa?
David Miller top-scored with 139 off 108 balls.
Who took the most wickets in Australia vs South Africa?
Kagiso Rabada took 3/40 in 10 overs.
Who played in Australia vs South Africa?
Australia XI: Chris Lynn, Aaron Finch (c), Shaun Marsh, Travis Head, Marcus Stoinis, Alex Carey (wk), Glenn Maxwell, Pat Cummins, Mitchell Starc, Adam Zampa, Josh Hazlewood. South Africa XI: Quinton de Kock (wk), Reeza Hendricks, Aiden Markram, Faf du Plessis (c), David Miller, Heinrich Klaasen, Dwaine Pretorius, Dale Steyn, Kagiso Rabada, Lungi Ngidi, Imran Tahir.