







Australia vs South Africa Scorecard · One Day Internationals 2018







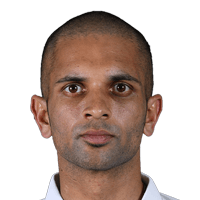

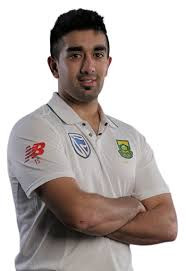









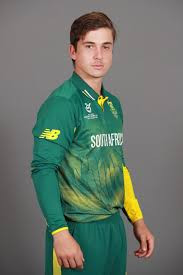





Statz Rating
A contextual performance score measuring each player's overall impact in the match. Scaled against the season so ratings are directly comparable across fixtures.
| Rank | Player | Rating |
|---|---|---|
| 1 |

Dwaine Pretorius
SA
|
137.0 |
| 2 |

Marcus Stoinis
AUS
|
100.7 |
| 3 |

Kagiso Rabada
SA
|
88.9 |
| 4 |

Josh Hazlewood
AUS
|
81.0 |
| 5 |

Dale Steyn
SA
|
75.8 |
| 6 |

Pat Cummins
AUS
|
66.7 |
| 7 |

Mitchell Starc
AUS
|
60.5 |
| 8 |

Lungi Ngidi
SA
|
50.5 |
| 9 |
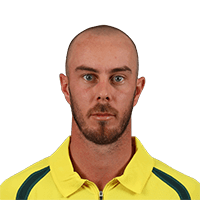
Chris Lynn
AUS
|
41.7 |
| 10 |

Imran Tahir
SA
|
34.4 |
| 11 |

Adam Zampa
AUS
|
33.2 |
| 12 |
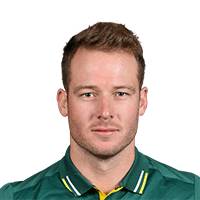
David Miller
SA
|
32.1 |
| 13 |

Faf du Plessis
SA
|
30.7 |
| 14 |

Aiden Markram
SA
|
26.4 |
| 15 |
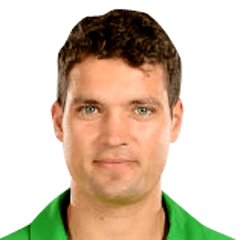
Alex Carey
AUS
|
25.3 |
| 16 |

Aaron Finch
AUS
|
23.1 |
| 17 |

Shaun Marsh
AUS
|
22.1 |
| 18 |

Glenn Maxwell
AUS
|
18.0 |
| 19 |
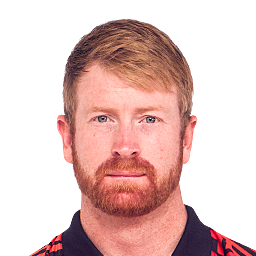
Heinrich Klaasen
SA
|
17.3 |
| 20 |

Reeza Hendricks
SA
|
12.2 |
| 21 |

Quinton de Kock
SA
|
11.9 |
| 22 |

Travis Head
AUS
|
11.3 |
How Statz Rating works:
- Each player receives a contextual match impact score based on their all-round contribution — batting, bowling, and situational factors.
- Ratings are scaled against the season benchmark so they are directly comparable across fixtures and to the season leaderboard.
- A typical top performer scores around 100. Exceptional performances can exceed 100.
Australia vs South Africa: result and key facts
Australia won by 7 runs in One Day Internationals 2018 at Adelaide Oval on 9 November 2018. David Miller top-scored with 51 off 71 balls and Kagiso Rabada took 4/54.
Frequently asked questions
Who won Australia vs South Africa?
Australia won by 7 runs.
When and where was Australia vs South Africa played?
Australia vs South Africa was played at Adelaide Oval, Adelaide on Friday 9 November 2018, in One Day Internationals 2018.
What were the final scores in Australia vs South Africa?
Australia scored 224/9 in 50 overs. South Africa scored 231/10 in 48.3 overs.
Who was the Statz MVP in Australia vs South Africa?
Dwaine Pretorius was named Statz MVP, earning a Statz Rating of 137/100. The Statz Rating combines batting impact, bowling impact and match context.
Who was the top run-scorer in Australia vs South Africa?
David Miller top-scored with 51 off 71 balls.
Who took the most wickets in Australia vs South Africa?
Kagiso Rabada took 4/54 in 9.3 overs.
Who played in Australia vs South Africa?
Australia XI: Aaron Finch (c), Travis Head, Shaun Marsh, Chris Lynn, Alex Carey (wk), Glenn Maxwell, Marcus Stoinis, Pat Cummins, Mitchell Starc, Adam Zampa, Josh Hazlewood. South Africa XI: Quinton de Kock (wk), Reeza Hendricks, Aiden Markram, Faf du Plessis (c), Heinrich Klaasen, David Miller, Dwaine Pretorius, Dale Steyn, Kagiso Rabada, Lungi Ngidi, Imran Tahir.